Would you want your birthday cake to be 1 day early or late?
On-time delivery (OTD) is the main metric to measure the efficiency of supply chain processes in your organization. It is an indicator of how capable your organization is to meet customer demand in terms of the requested delivery date (RDD). Failing to meet your customers’ requests can lead to all sorts of negative outcomes. Worst case? You lose your customers to competitors.
At Argon & Co, we experience a vast array of different interpretations and calculations of the on-time delivery metrics. This indicates that customer-centric Outside-In™ thinking is not at the heart of every organisation.
Over the years we made the following observations regarding OTD.
- OTD is simply measured as a ratio of the number of units on time divided by the number of total units shipped on a monthly base.
- It is not clear how the number of units on time is calculated.
- OTD calculation reference points are unclear; e.g. are they based on RDD, first confirmation date (CDD) or last CDD?
- The shipment date is used for actual delivery date (ADD), not the actual delivery date on the customer’s premises.
- Early deliveries without customer approval (e.g. month end pressure) are defined as delivered on time.
- OTD is calculated on order level, not on order line level.
- There is confusion about delivery windows.
All observations are symptoms of a distorted view on on-time delivery as KPI of your supply chain performance. Quite frequently we see surprised looks when we present actual OTD Outside- In™ results that are not anywhere near the 90% that was expected by the management.
Measure your Span
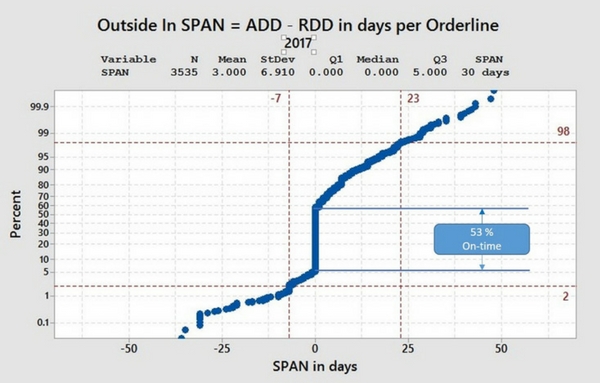
From a diagnostic and executional perspective, it is much more powerful to measure and analyse Span, a metric developed by General Electric (GE). Outside-In Span takes the customer’s voice as a starting point. Process performance is measured against the requested delivery date (RDD) at order line level, not order level. It generates a variance-based view of each order line delivery performance. The Outside-In view prevents performance data being manipulated simply to ‘manage the metric’.

In the example above, only 53% of all order lines did the actual delivery on site match the customer requested delivery, with a Span 98/2 of 30 days. 5% of all order lines were shipped too early (up to 35 days) and 40% of all order lines were shipped too late (up to 48 days).
Identify and eliminate root causes
Obviously, the goal is to reduce the Span of 30 days to a minimum, bringing as many order lines to the centre line. To achieve this, the following issues need to be resolved:
- Why does this company allow order lines to be delivered up to 35 days early?
- Why does this company deliver up to 48 days late?
The underlying root causes for the issues above are often planning and operational issues that need to be tackled in order to reduce Span. To understand the root causes of early and late deliveries, detailed process analysis is required. Root causes need to be identified and eliminated. This often requires a paradigm shift in terms of operational and supply chain strategy.
You definitely need a clear understanding of the on-time delivery your customers actually experience. The introduction of the Outside-In™ Span metric allows you to control and improve your supply chain performance at a transactional level. This benefits your customers, as they get delivered what they want exactly when they want it. On time!


