Sustainable operations: measuring the environmental footprint of products is essential for transformation
Few companies are able to answer the simple question: “What is the environmental impact of manufacturing, distributing and using our products?”.
Measuring the environmental footprint of products is the necessary first step in launching an environmental transformation plan. It defines the starting point, against which improvements can be compared. It also raises awareness across the organisation of issues around environment impact, galvanising colleagues to drive transformation.
This article describes the scope and methods used in measuring environmental impact, and follow-up actions to consider.
Environmental impact is more than just your carbon footprint
Environmental aspects of Corporate Social Responsibility (CSR) reports are generally limited to quantifying emissions directly generated by the company – defined as Scope 1 and Scope 2 according to the Greenhouse Gas Protocol. This scope is limited in a number of ways.
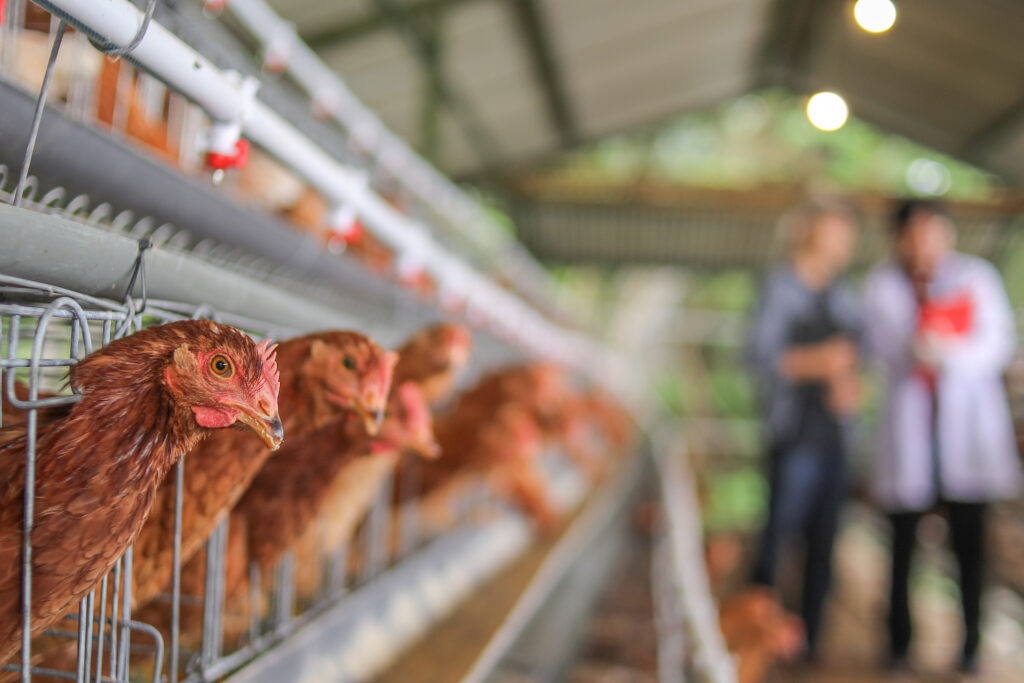
First, it covers the emissions generated by support functions (offices, transport), but only a part of the impact of manufacturing (from raw materials to finished products) and distribution. For companies operating in a number of industries such as luxury goods, telecommunications, retail, and automotive, Scope 1 and Scope 2 emissions may make up less than 20% of the total.
Second, CSR reports are often limited to CO2 emissions, without considering other environmental impacts such as water consumption, waste emissions, air pollution and pressure on the soil.
What is the best way to conduct this type of analysis?
The best way for a business to get a complete and reliable view of its environmental impact is to carry out a Life Cycle Assessment (LCA) across its operations.
Stage one: mapping and scoping
The first stage involves mapping the extended value chain, with the aim of defining the scope of the LCA.
The complexity lies in the multiplicity of factors having an environmental impact. CO2 is the best known, but the generation of waste, water consumption, air and water pollution, and pressure on soils are also important factors. The scope should include all, or as many of these as possible, to establish their scale and significance.
Mapping the value chain supports the measurement the environmental footprint of products from end to end. The value chain generally breaks down into three main phases; the creation of raw materials, the production of finished products, and then their distribution to consumers. Further phases that can be considered are product use by consumers, and ‘end of life’ including disposal or recycling. These phases can be broken down into one or more sub-steps, depending on the nature of the products.

Stage two: data collection and analysis
Once the scope has been defined and agreed, all the necessary data should be collected for analysis. What these data are, and their sources are varied, and may include product data (raw materials, nomenclatures, weight, volumes, service life), supplier data, transport data (flow diagram, mode of transport, filling rate), energy data and waste data.
Some data – such as information about transport – are relatively easy to collect and interpret. In other cases, it is more complex and difficult to get good data, for example information relating to suppliers – especially those in tiers 2 and 3.
Our recommendation is to use existing data and analysis where possible, such as factors of emissions of raw materials and life cycle analysis.
This stage will often take a lot of time and effort, and a pragmatic approach is required. Assumptions will need to be made and rough-cut data used; analysis can be refined when better information is available.
Stage three: interpreting the results
Analysis of environmental impact data can be very technical and difficult to understand by non-experts. Interpretation and communication of the of the findings requires taking a macro view to identify the key relevant messages, and to ensure a clear and consistent understanding across the organisation.
It is important that the context is taken into account when communicating findings. Any benchmarks or comparisons should be explained; a measure is rarely universally comparable. For example, a cubic metre of water consumed in a country under severe water stress has greater value than the same quantity in a region with abundant water.
Stage four: identifying and prioritising levers
Based on the analysis carried out, the most promising levers for reducing the environmental footprint can be identified. These levers are based on transforming operations; examples from different parts of the value chain are:
- Product development: ecodesign, including integrating the footprint generated by the product during its use and end of life
- Purchasing: sourcing from responsible, local suppliers
- Production: production techniques with lower environmental impact
- Distribution: modes of transport with lower carbon footprint
Specific examples of levers identified in the fashion and luxury industry are as follows:
- Use of recycled materials
- Reduction in the amount of air transport vs. sea or train
- Switching to organic cotton
- Reducing the need for employees to commute to work daily
In the qualification and prioritisation of these levers it is important to highlight the broader impacts, for example on cost, stock, or service levels, to provide a balanced view of the trade-offs.
In our experience the initial environment footprint analysis provides significant insights, challenging accepted wisdom and the current roadmap to reducing environmental impact. Priorities will be re-ordered, and new high-value levers are added.
How should the initial analysis be followed up?
The initial LCA of the value chain provides a solid base for the launch of an environmental excellence and impact reduction plan, focused on the priority levers identified. This will drive down the product environmental footprint and provide transparency to new and existing consumers. Companies such as L’Oréal and Kering have understood this and have benefited from very positive outcomes. L’Oréal, for example, has reduced CO2 emissions of its factories and distribution centres significantly since 2005.
This LCA should not be treated as a one-time analysis. We recommend that it is regularly updated in order to be able to quantify developments and communicate improvements. For example, it is informative in the luxury or fashion industry to measure the impact of each new collection.
Transforming your operations to be more environmentally responsible is also a great opportunity to unite and motivate your employees, by giving additional meaning to their work.
To find out more, please take a look at the Sustainable operations service page on our website argonandco.com, this page also contains a contact person for your region
Share: