The world today continues to navigate a sea of uncertainty, with escalating global trade tensions creating particular challenges for businesses. President Trump’s administration has reintroduced significant tariffs and trade barriers since his January 2025 inauguration, reigniting trade conflicts with China and implementing new protectionist measures affecting the EU and other major trading partners. These policy shifts have disrupted supply chains, increased input costs, and created unpredictable market access conditions for companies across sectors. The Middle East remains a flashpoint despite diplomatic efforts in the Israel-Gaza situation, while the Russia-Ukraine conflict persists, further complicating global commerce and resource flows. Financial markets reflect this turbulence, with heightened volatility as investors struggle to price in the implications of these rapidly evolving trade dynamics.
For business owners, navigating these volatile times requires a deep understanding of their financial standing. Identifying which products, customers, and geographical markets bolster or drain profitability is essential. By focusing on the most viable areas, you can build resilience and secure competitiveness.
This blog provides a starting point to gain these deeper business insights, helping you identify and address profit leaks for a stronger financial footing.
Which insights to create – true profitability analysis 101
You monitor your P&L closely, both overall and segmented into product lines or markets. Contribution margins are calculated after deducting direct costs like materials, energy, and labour, while EBITDA accounts for indirect costs such as supply chain expenses, SG&A, and promotional spending. On the surface, your financial performance may appear satisfactory, and your gross margins might align with industry benchmarks.
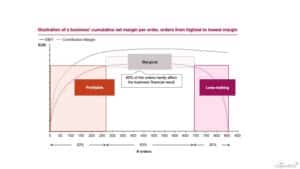
But a deeper dive into your data—examining the P&L of individual SKUs, customers, or orders—can reveal hidden profit drains. The cumulative profitability pattern of your individual products or orders often resembles an upside-down bathtub:

- A small number of products or customers contribute substantially to your total margin
- Many add only marginally but help cover true fixed costs
- A portion actively erodes profitability and should be diligently scrutinised; what is the story behind these orders, products, or customers? Can we raise prices, adjust the production process, should we discontinue these types of products or customers?
The only way to get this deep insight into your products and customers is by heavy number crunching!
How to do it – true profitability analysis 101
To create your unique order or customer profile, you should follow these three steps:
- Map SKU-specific processes – Understand every subprocess your SKUs/orders go through, including collecting data on processing times, materials used, and waste created in each step of the process
- Allocate indirect costs fairly – For as many ‘in’direct costs as possible (direct personnel costs, machinery maintenance, machinery depreciation, housing, …), determine the drivers to allocate costs accurately across orders. Some examples:
- Premises costs: Allocate rent according to the floor space used by a subprocess. E.g. for a machine occupying 20 m², you assign the proportional housing costs to this machine, and then split these costs over all orders using that machine
- Consumables: Allocate machine-specific costs, such as oil or labels, based on the hours each product or order occupies the machine
- Adjust for underutilization – Fixed costs of underused assets can distort contribution margins for currently sold products. To avoid drawing the wrong conclusions— run a secondary scenario in which you assume full asset utilization for a clearer picture
How to valorise – true profitability analysis 101
Now that you have moved from high-level P&L insights to detailed cost allocations to every product or customer, it’s time to zoom out again and evaluate the bigger picture. Use your new insights to ask critical questions that can guide your next steps:
- What patterns emerge among loss-making products? Are certain subprocess costs underestimated in your pricing models? Could you increase prices for products tied to specific cost-intensive steps, or should you rationalise your product portfolio?
- Which products and customers are the most profitable? Explore opportunities to introduce successful products into new markets or increase sales in the most profitable customer segments
- Which subprocesses lead to highest product costs? Are these costs competitive compared to global benchmarks? Investigate ways to reduce costs, such as improving labour efficiency or investing in more innovative machinery
- How does asset underutilization affect your overall P&L? Consider the potential profit impact of increasing sales of your current product mix. What would your ability look like under full asset utilization? And what is the impact of a changing product mix?
In conclusion, increasing resilience in today’s volatile world means diving deep into your business’s financial landscape. The road may be uncertain, but with clear financial insights, you can steer your business towards sustainable growth and profitability. Looking for extra guidance? We are here for you to discuss your specific business challenges!


