Adjusting production capacity in response to changes in the market is a strategic challenge for companies. Whether in a scenario of high demand, or during a corporate merger that requires a reassessment of global capacity, or even in times of market downturn, global equipment efficiency (OEE¹) is the key metric and the 85%² level is the international standard that considers the inefficiencies inherent in factors of availability, performance and quality.
However, reality shows that many companies tolerate a high level of waste, leading to OEE results below 85%, and do not adopt consistent practices to improve these inefficiencies. This often hides significant deviations caused by the volatility of production processes. As a result, companies may require additional capacity, incurring high costs with new investments or increased shifts and additional resources.
To address these challenges, the Stable Ops® methodology was developed, an initiative by Jack Welch to explore new applications of six sigma at GE (General Electrics). GE’s plastics division demonstrated the effectiveness of the methodology by increasing production by about 35% in 12 months, without significant capital investments.
Stable Ops consists of a 10-step method based on the DMAIC³ system, designed for situations that require an increase in production capacity, either due to an increase in volume, where the machine must give more production more efficiently, or due to the need to reduce costs with fewer shifts.
In the day-to-day life of a production area, many events can impact efficiency, and thus impair OEE. Some are caused by a natural variation of the stable process. Others are sporadic and random, the result of unusual events, which make the process unstable. In the graph below, the stable process is represented by the color burgundy and the unstable by the color orange. Random causes of instability are mitigated through Stable Ops®, resulting in a stable process that maximizes production and stability.

The slope of the distribution of the unstable process can be represented by the statistical indicators of quartiles Q1 and Q3, composing the stability factor (FS), where FS = Q1/Q3 and which in a condition of high stability would be 0.95, a metric that justifies the need for new investments.
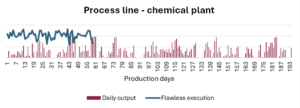
A practical example of the potential of Stable Ops® is evidenced by the diagnosis executed for a customer in the chemical segment, who sought to reduce investments in new machines through a better use of existing assets. We looked at a specific process
with the six-month history, and the burgundy bars in the chart below show the actual daily production output. The blue line represents the volume that could be achieved if the process were stable.

The analysis showed that, without failure, daily production could be higher by more than 230% if instability was eliminated, reaching an FS of 0.80. In addition, we identified margins for further improvement through process optimizations and standardizations.
In this case, the company did not use OEE as a controlled indicator in this line, limiting itself to the managerial view of this index. This shows how the lack of effective volatility monitoring can hide significant opportunities for improvement.
The volatility of the example cited is significant, and underscores a crucial point: OEE alone may not be sufficient to identify opportunities for production gains, since it does not consider the volatility measure. This is the fundamental distinction between OEE and the FS stability factor for strategic decision-making related to increasing capacity with new investments. New investments should not be made with unstable processes, which entails additional costs to the final product due to the lack of initiatives to solve abnormal volatility – the inclination that tends to pull the distribution towards lower results. Our experience shows that many companies that run with full machines have hidden capacities in the order of 30% to 50% caused by unresolved volatilities.
Statistics are nothing new to companies. Many have already incorporated Statistical Process Control (SPC) for product attributes such as dimensions, weight, humidity and temperature. By expanding this statistical approach to include volatility also in processes, the possibility arises to transform the Stable Ops® methodology into a management tool, as Cargill, GE, ABB and Arkema have done successfully, conducting their processes in a more stable way, whether they are productive, logistical or administrative, where volatility can be analyzed, understood and improved and thus obtain substantial results.
¹ Overall Equipment Efficiency
² Pinto, J. P. (2013). Manutenção Lean, Editoria Lidel, pág 65
³ Define, Measure, Analyze, Improve, and Control


