GETTING STARTED
Now the big question is “How do I get started?” There are three main sources of data needed. Since much of this information is usually stored on computers, they are commonly referred to by their “MIS” name, i.e. item master records, order header and detail information, and inventory records.
What Data Do I Need?
The item master is a static file with each item’s stock keeping number, classification, weight, cube, pallet build, and dollar value. The order header information contains the name of the customer receiving the order, the customer’s location, and other information that is common to all lines on an order. The order detail record has information specific to a single line on an order. It contains the item ordered, the date ordered, quantity, etc. Inventory records provide the quantity on hand of a given item, in a given location, at a specific time.
Most of this data is available from your warehouse management system or inventory control application. Unfortunately, it is often inaccessible by PC users. In these situations, the IT staff should transfer this data from the mainframe to the PC via a zip disk, CD, or the web.
It is important to collect at least 6 months and preferably a year’s worth of data so that the profiles account for seasonal items. However, if there is little seasonality in your business and the products you ship are relatively static, less data may be used.
How Do I Manipulate the Data?
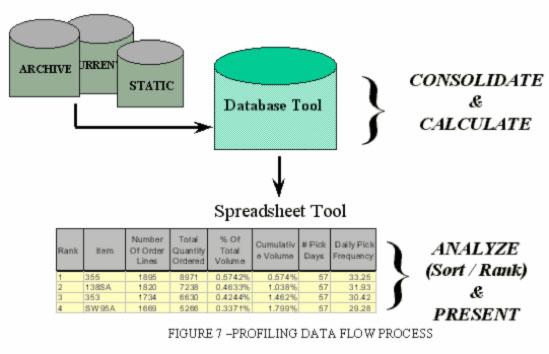
In most cases the data will require some manipulation and cleaning prior to analysis. Obsolete items will need to be removed and incorrect item numbers corrected before the data set is loaded. The clean data is loaded into a PC database product such as Microsoft Access. Once the tables are created in the database package, they are exported to spreadsheet software such as Microsoft Excel for sorting and ranking of the data to create the profiles. Typically, spreadsheet tools are better than database tools for sophisticated analysis such as developing a histogram of Order Cube. Figure 7 outlines the data flow profile process.
Activity Profiling Schedule Estimates
A profiling project’s schedule depends on data availability, fidelity, and the amount of analysis performed. While most projects can be completed in four to five weeks, the “X Factor” is the time it takes to identify where the data resides and exporting it to a tape or zip disk. Once this is done, the database loading process takes typically one week. This time includes creating the tables, running some preliminary queries, then exporting results to a spreadsheet for graphing or further analysis.
Next, the preliminary results need to be reviewed by your improvement team. This stage can take a couple of weeks. The first step is to review findings related to previously identified opportunities followed by selecting and evaluating new improvement areas. Overall, the profiling process should take about three to four weeks to determine reasonably good opportunities.
Profiling is a Great Tool If:
Benefits derived from a profiling project can be significant. The payback can also come quickly; however, watch out for three pitfalls. First, many companies find that ideas that were being considered before the analysis are no longer viable based on analysis of the data. More often than not, the real opportunities tend to be initiatives that were not thought of prior to the start of the project. The lesson here is to keep your eyes open and your mind prepared for doing something different.
Second, a word of caution about spending too much time on the analysis and getting mired in the data. A picture is worth a thousand words but too many pictures and numbers may prevent you from seeing the forest for the trees. It is important to have a clear understanding of your major warehouse goals and to decide on the data diagnostic set that will provide insight into your objectives.
Finally, activity profiling is not to be considered a one-time event. As your customers, products, and operations change, re-employ this tool to confirm current practices and look for new improvement opportunities. In this way, profiling can earn you a return for years to come and your warehouse can continue to provide you with clues for operations improvement opportunities.
As of September 8, 2020, Crimson & Co (formerly The Progress Group/TPG) has rebranded as Argon & Co following the successful merger with Argon Consulting in April 2018.


